Introduction
LEGEND
Calculate Promo Set Size
Step-by-Step Guide
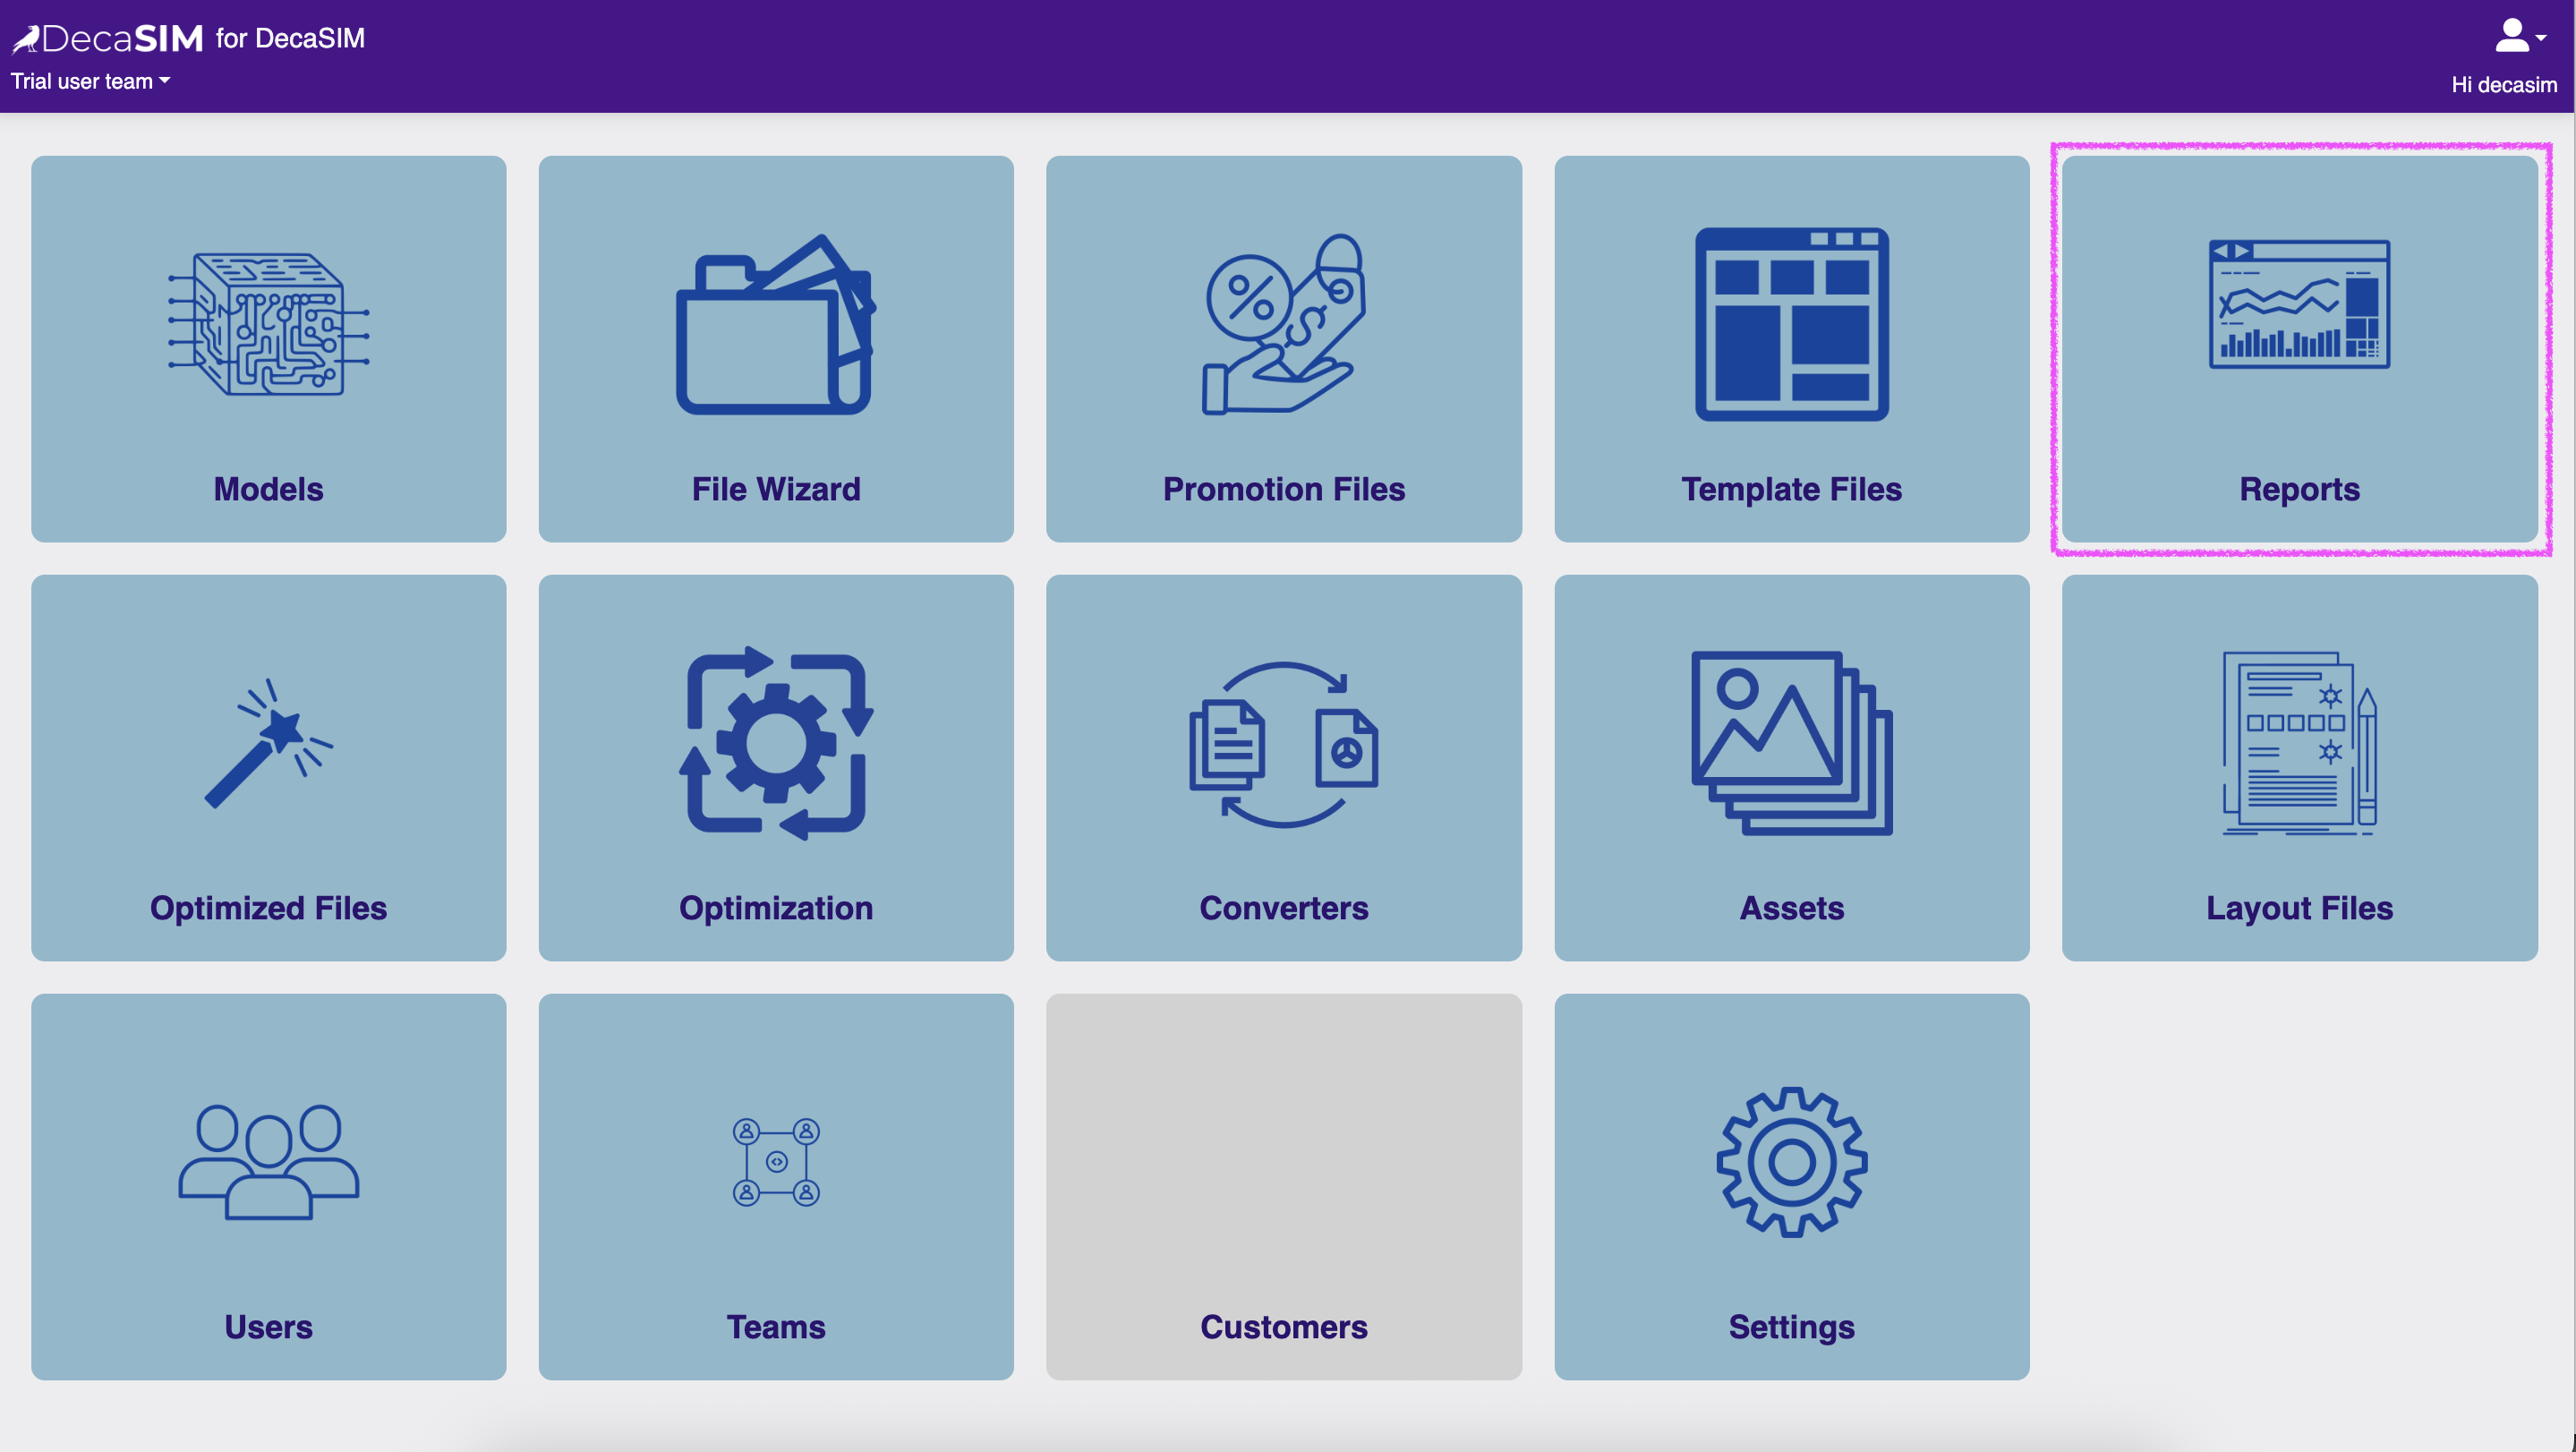
Starting at the dashboard, click the REPORTS card:
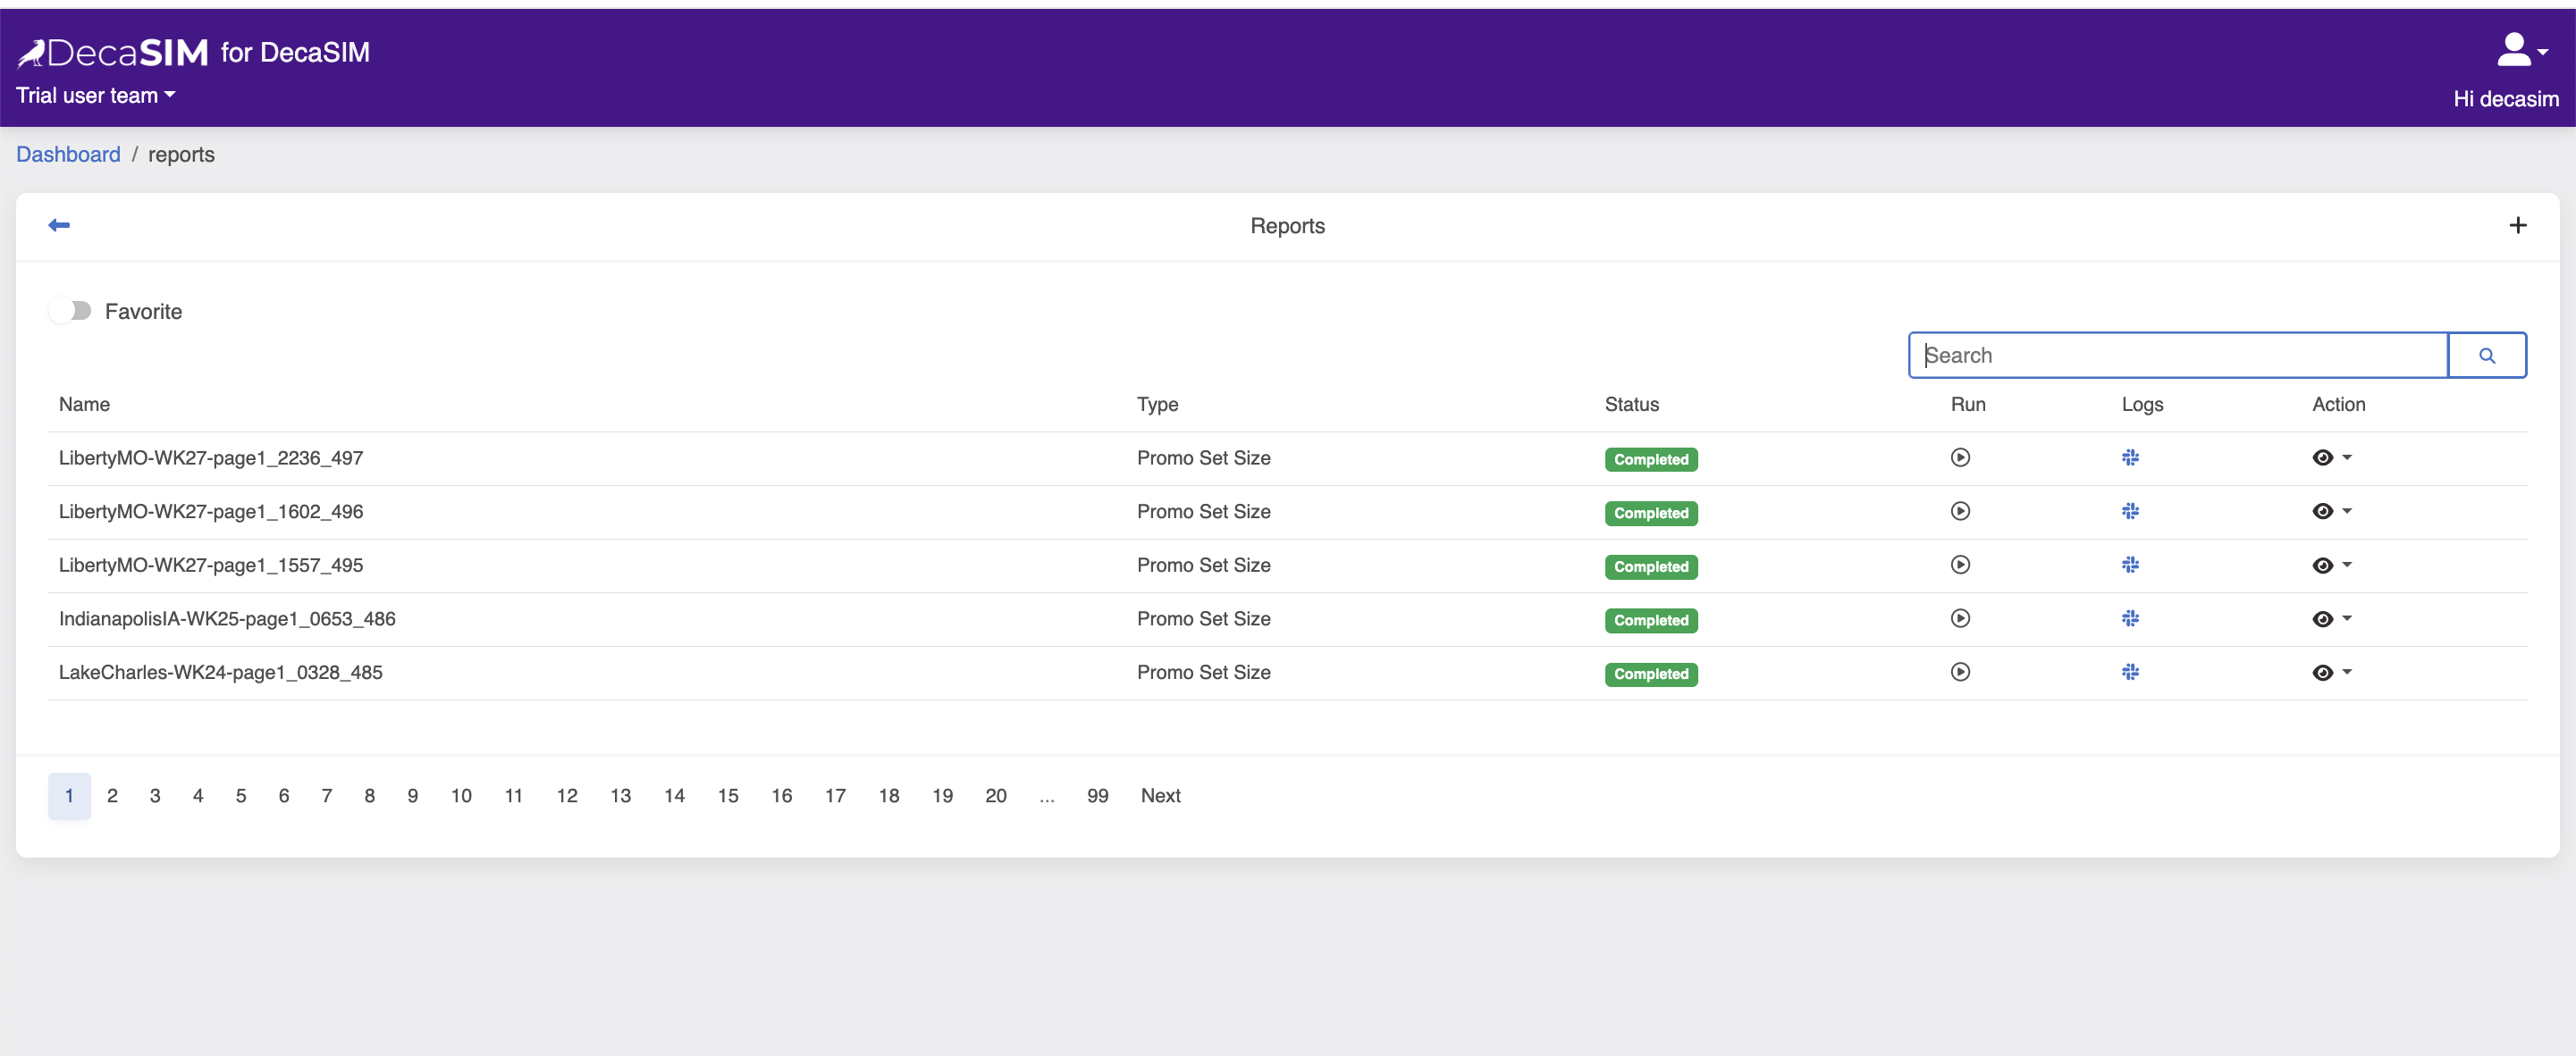
This displays the current reports:
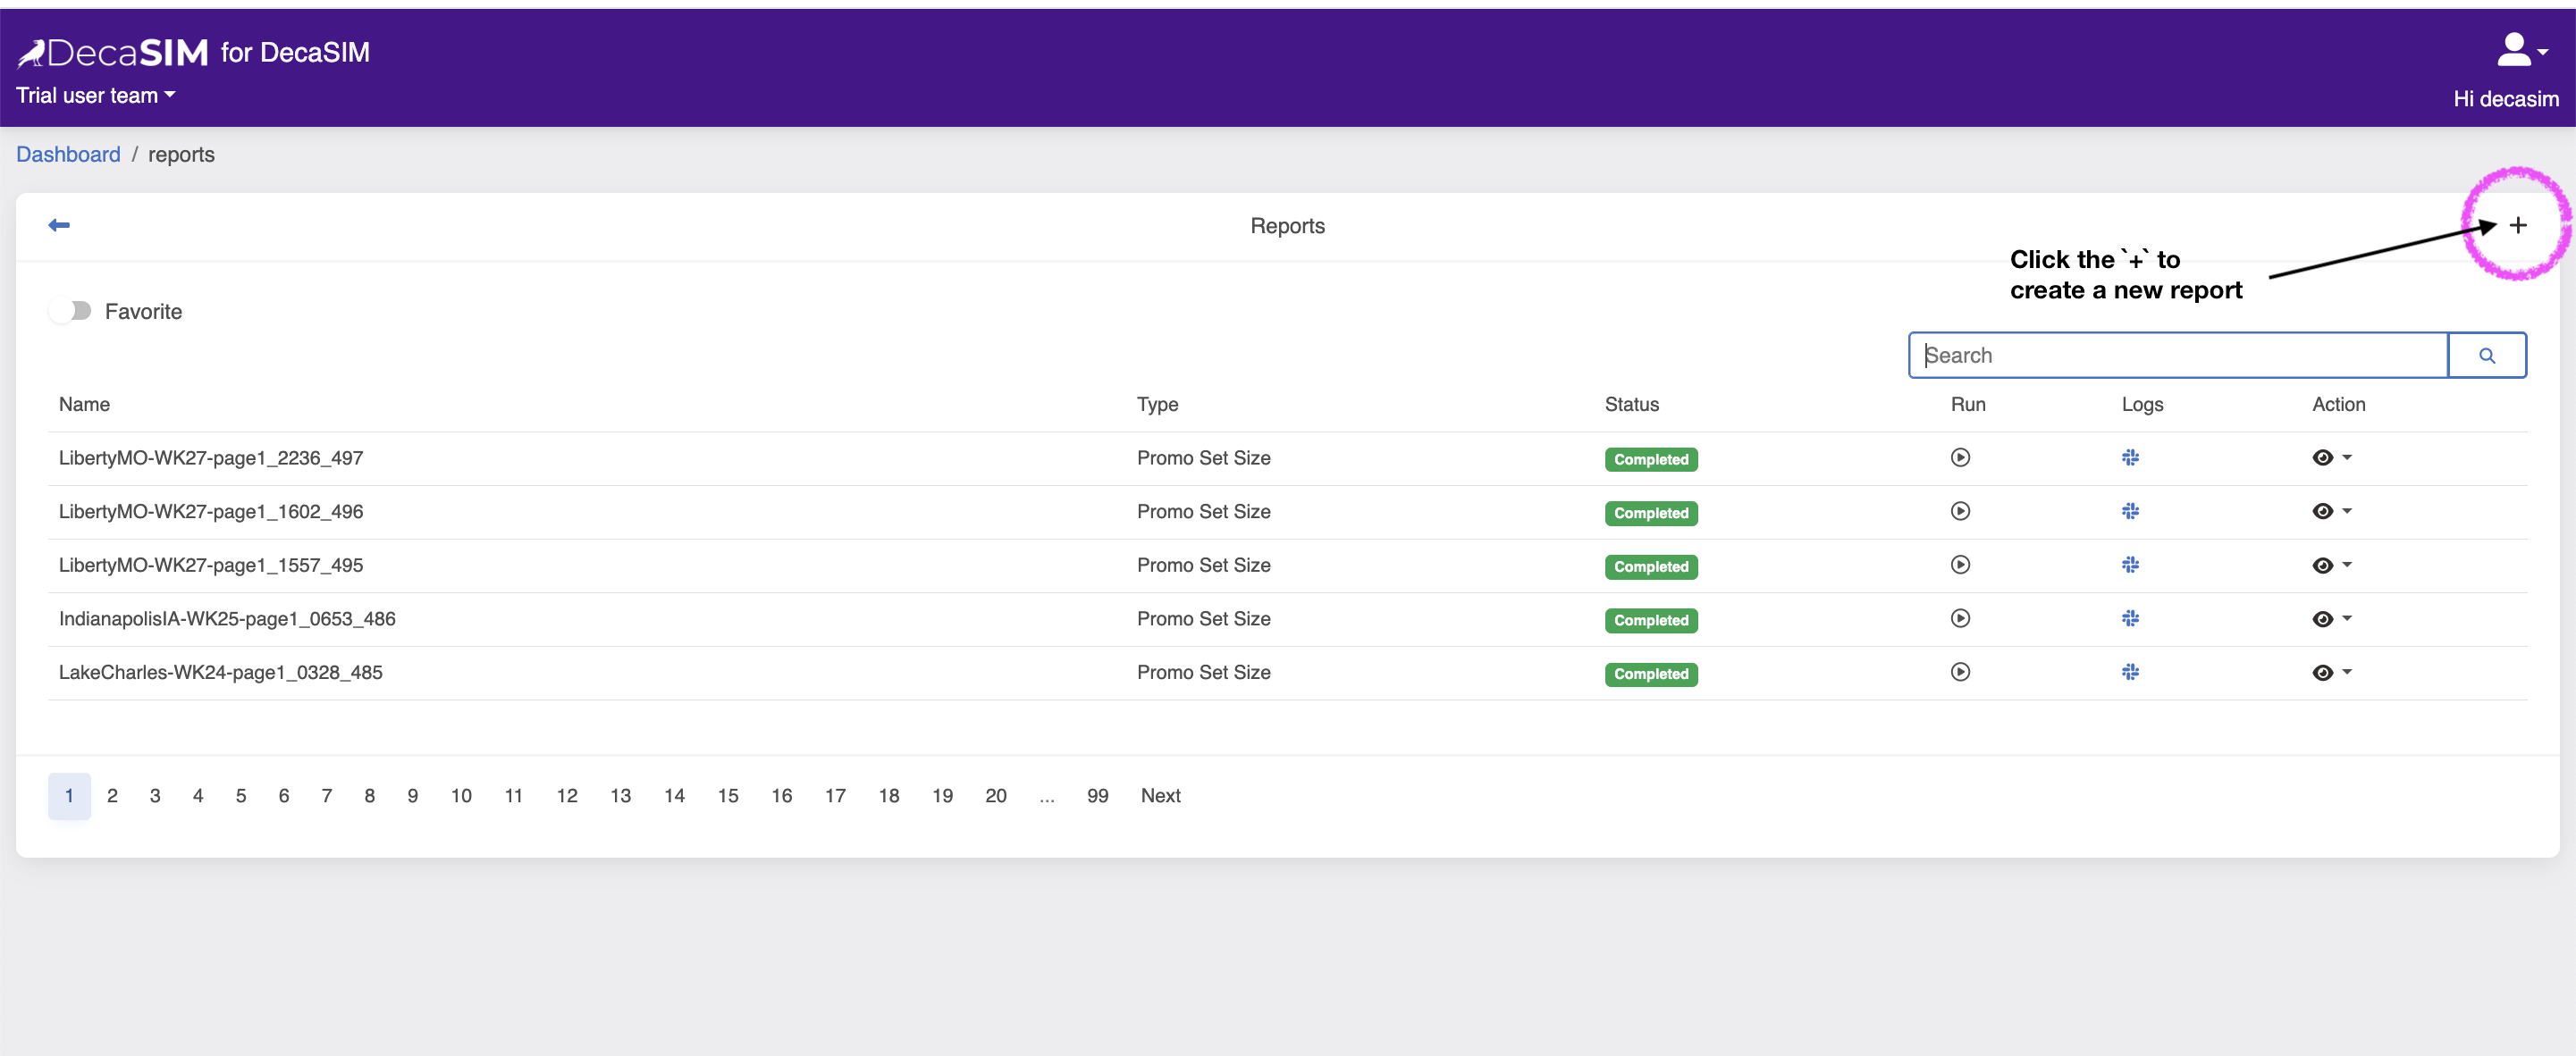
To create a new report click the + in the top right hand corner of the page.
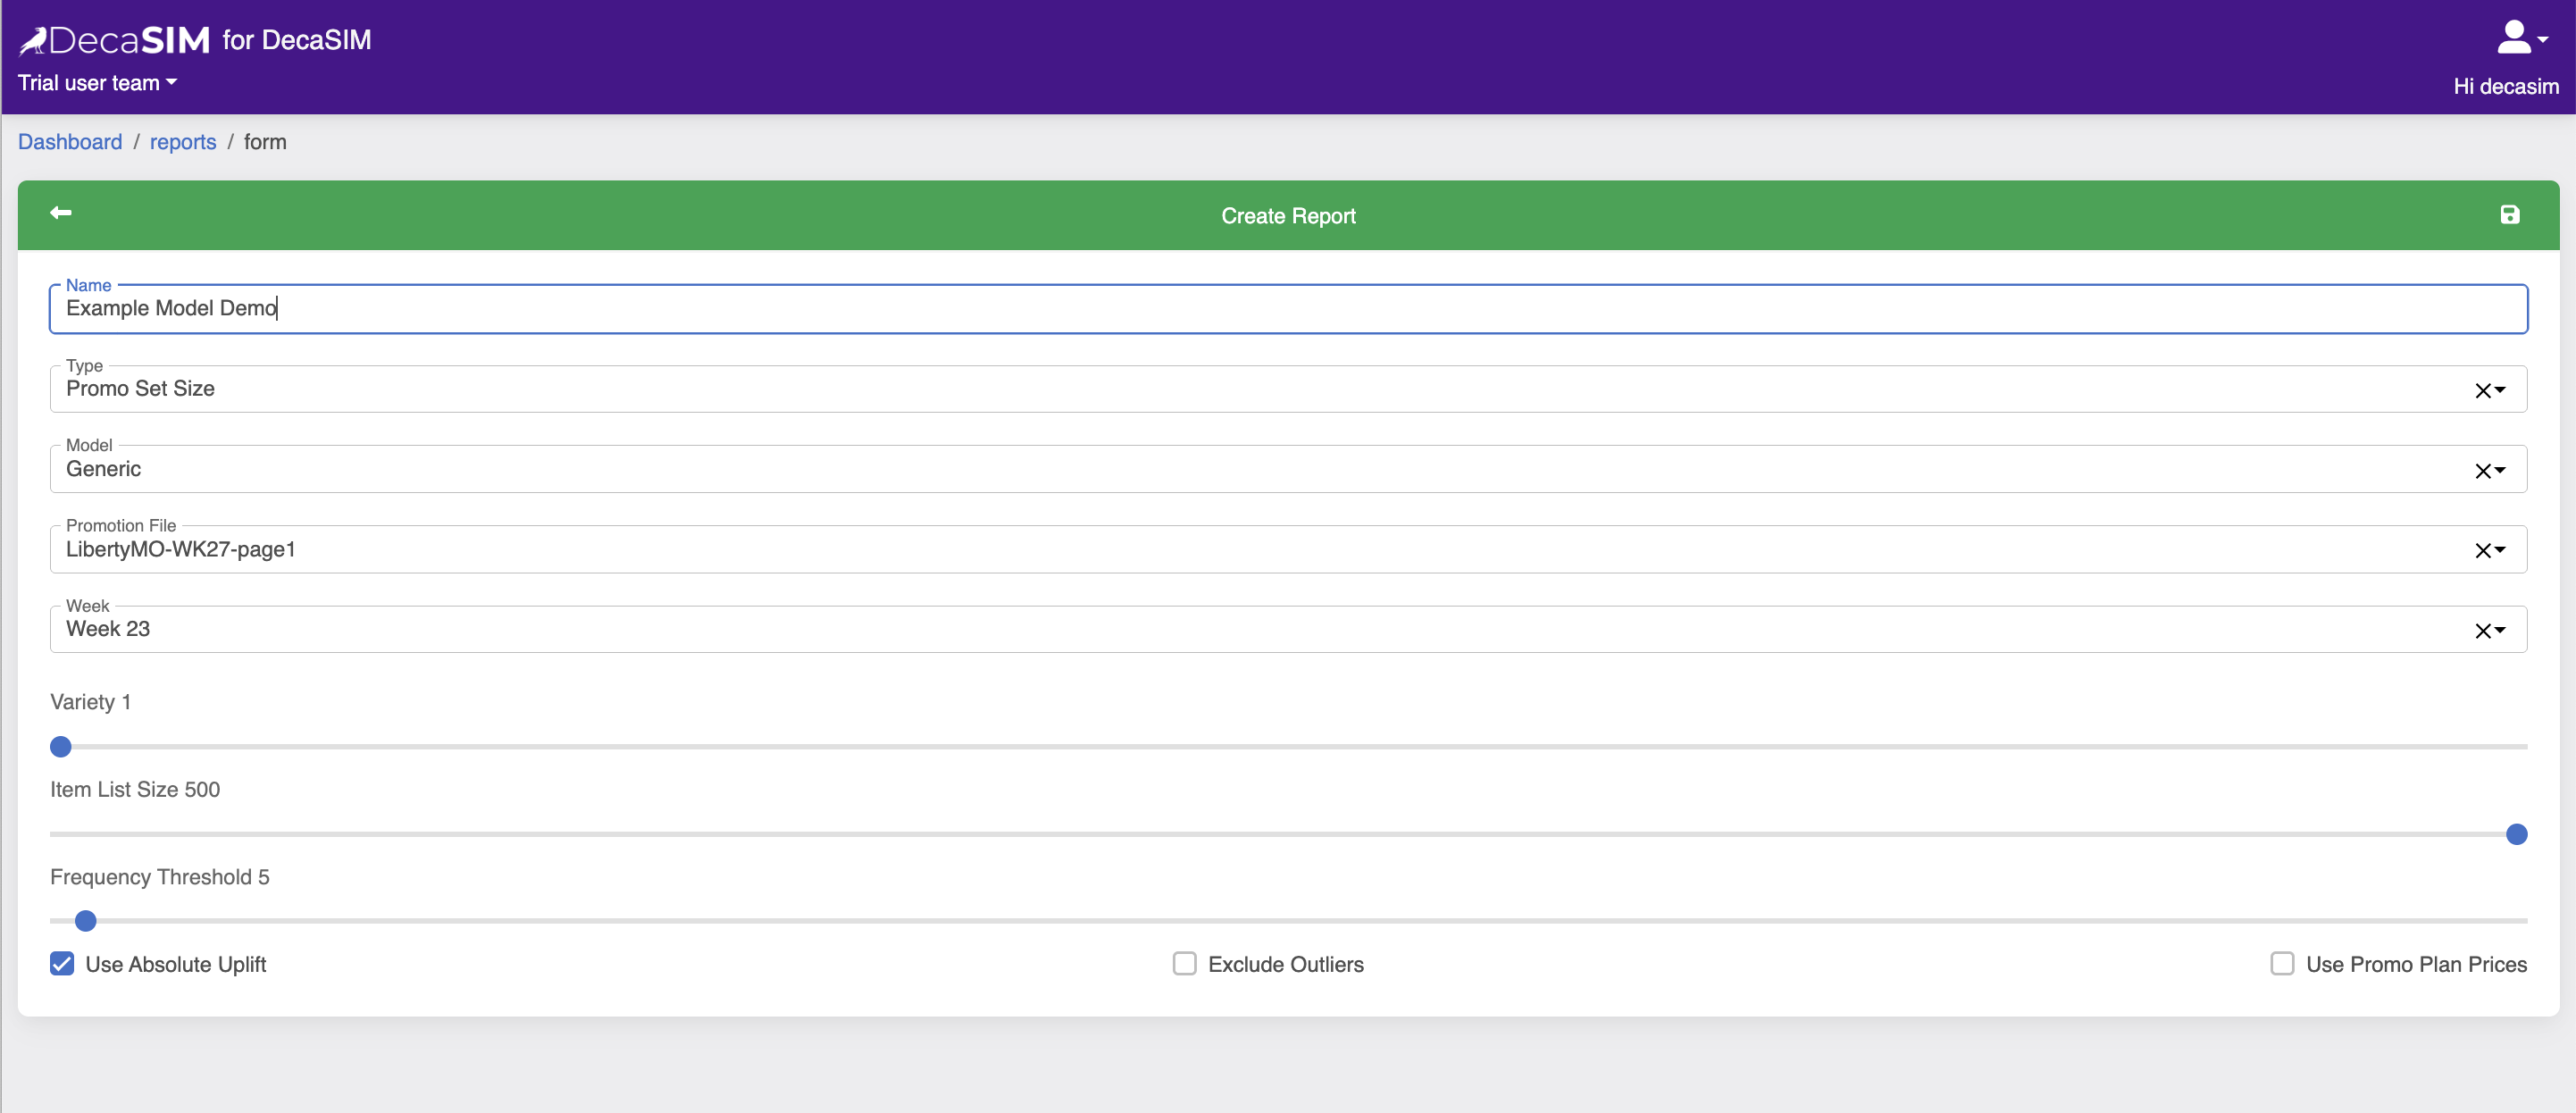
This displays a form with all the necessary configurations for a new report.
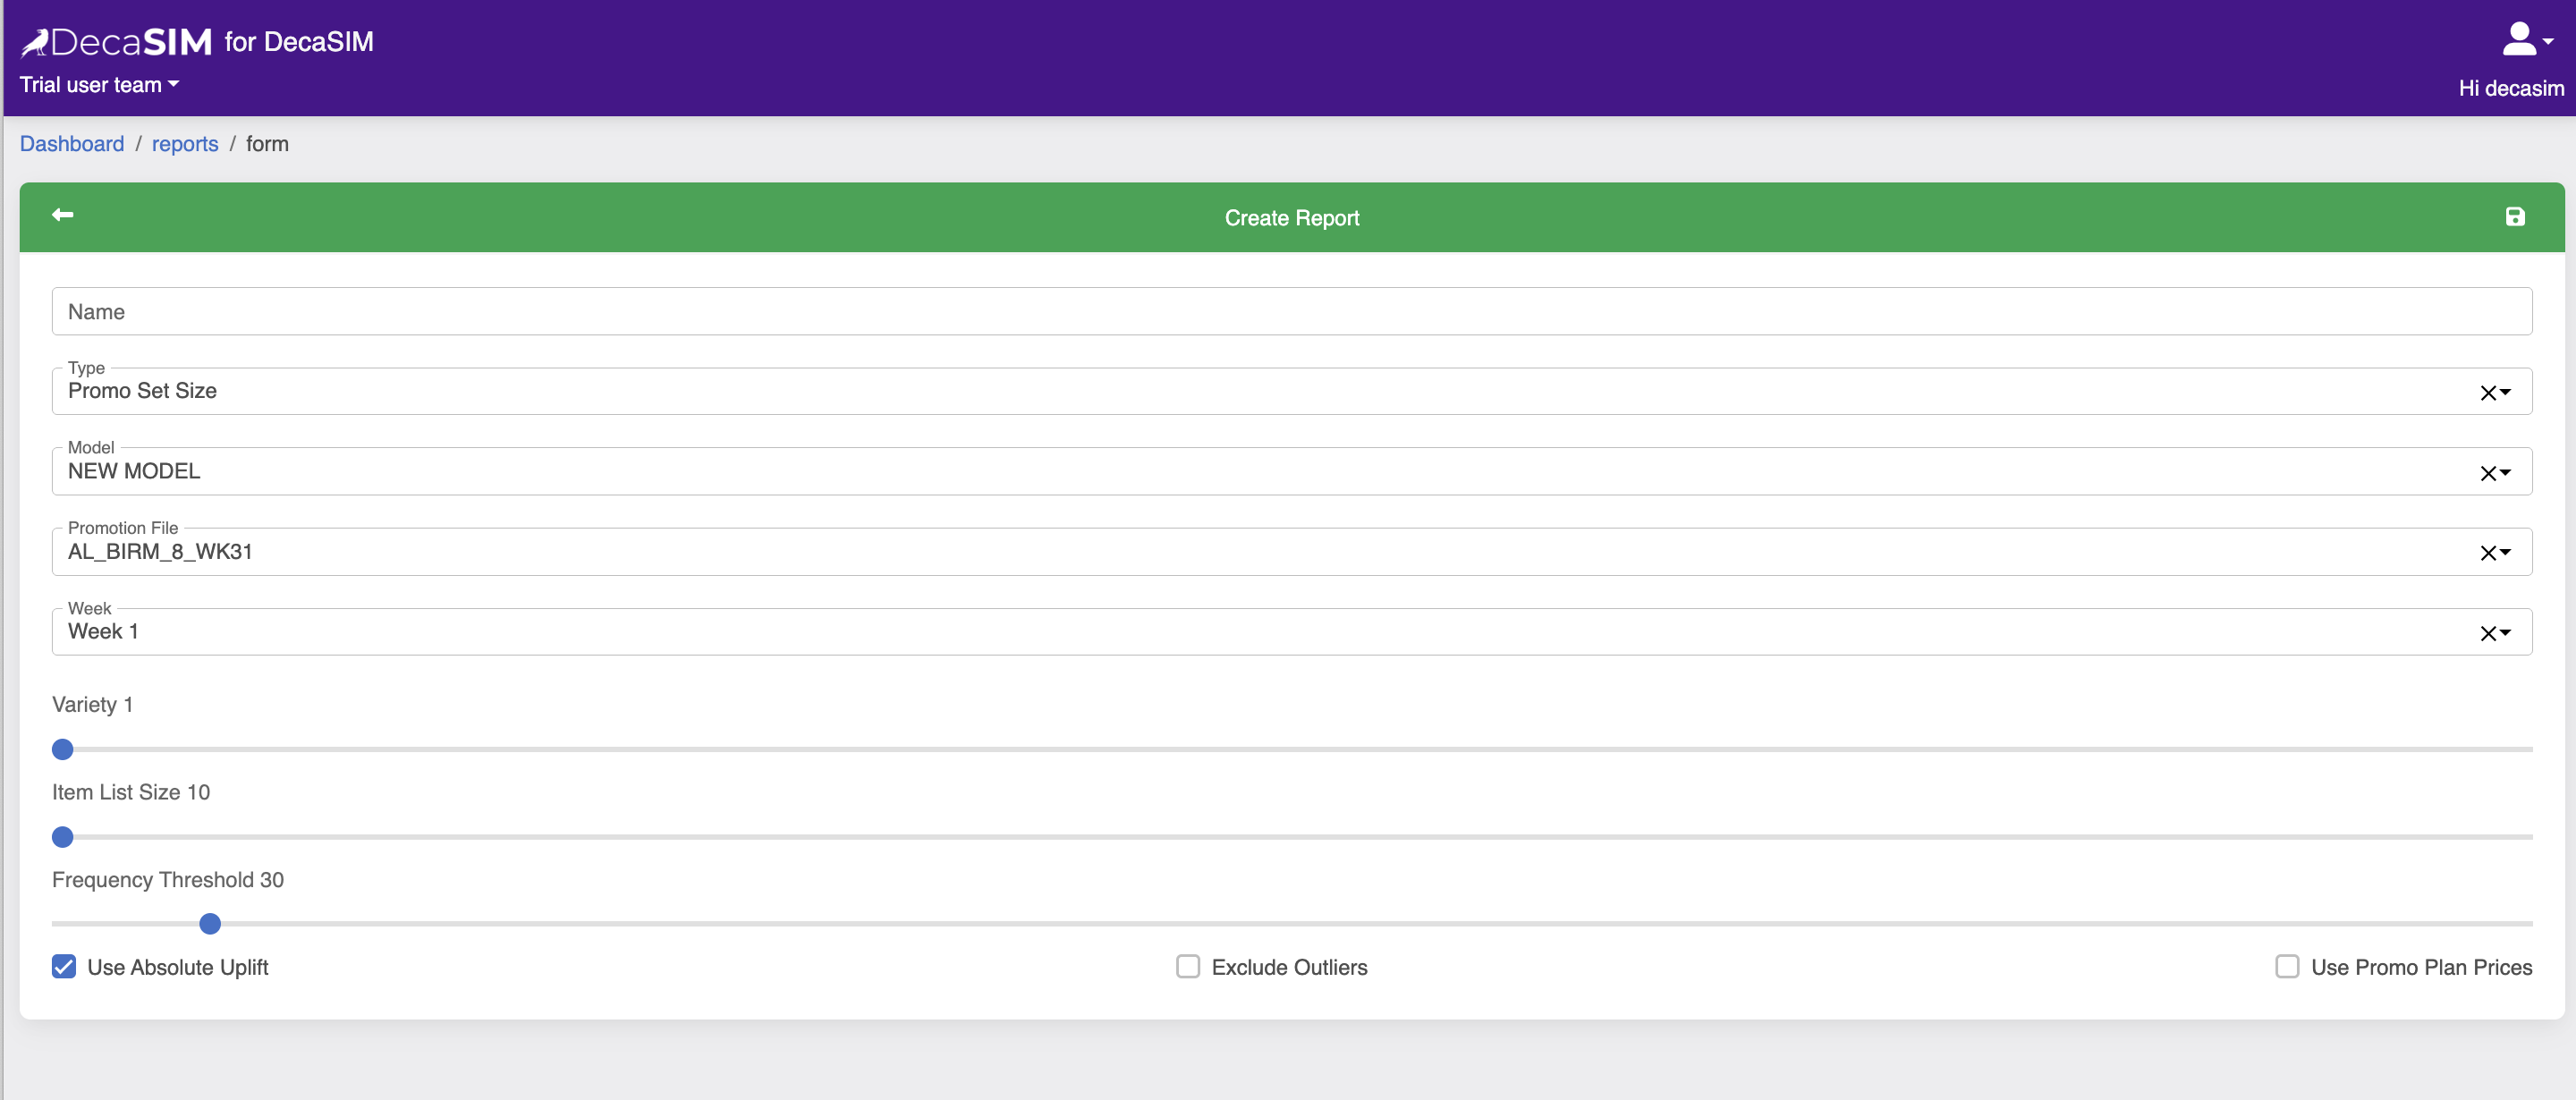
Select the MODEL you want to use - this by default dictates the PRICE ZONE that is used to filter the PROMOTIONS in the PROMO FILE. Select the PROMO FILE and specify which CAMPAIGN PERIOD to run.
Then tell DecaSIM:
- How much
Varietyyou want to see 1=Maximum 30=Minimum - How many promotions can
DecaSIMuse to maximize reach - typically we set this to 500 - Setting the frequency threshold to anything greater than zero allows you to tune the output somewhat. Increasing the
Frequency Thresholdincreases conviction of the parameters used to make predictions. Use Absolute Upliftshould be checked.Exclude Outlierscan be checked at any point after the report is created.Use Promo Plan Pricesshould be left unchecked.
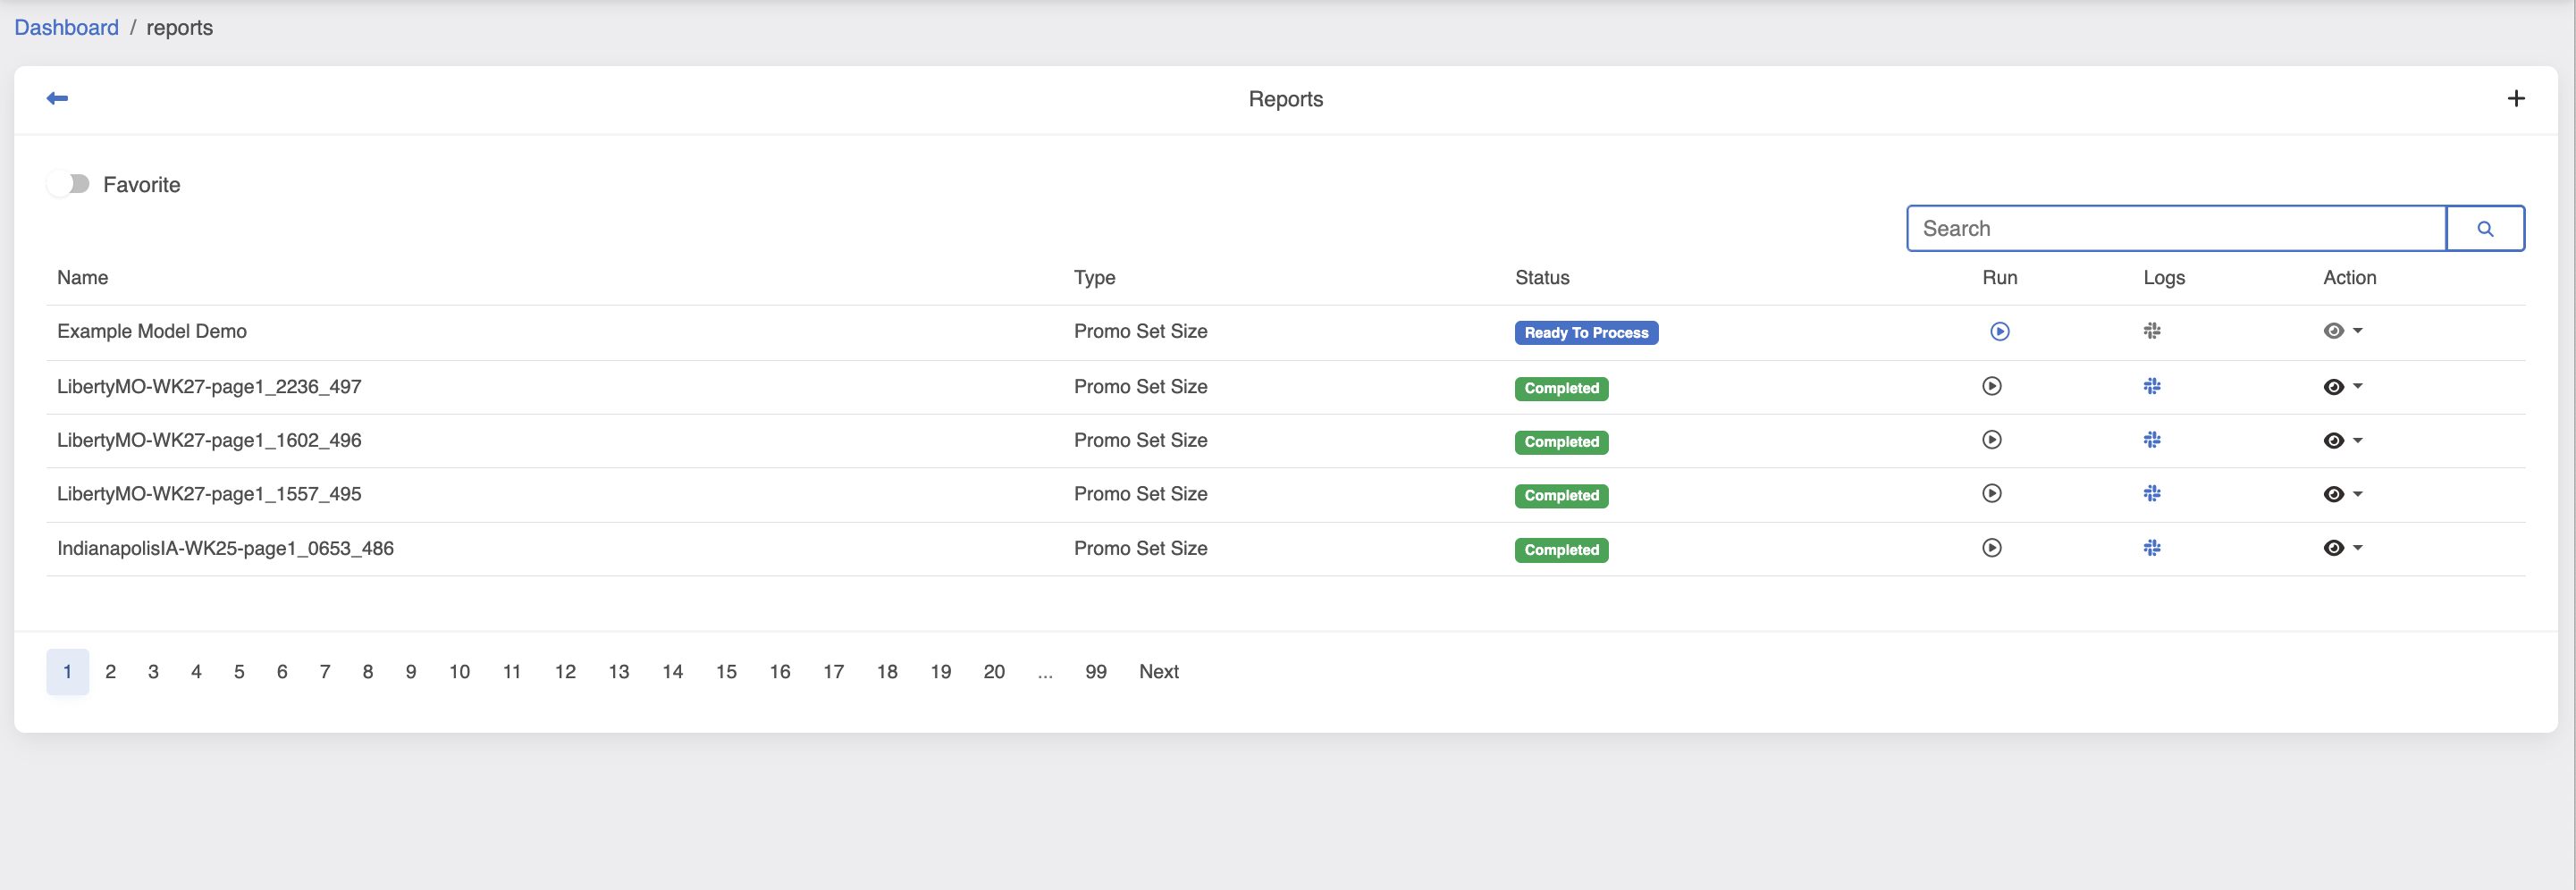
Once the desired values have been entered. Click the save icon, and you will be returned to the REPORT MANAGER
view and the new report has a status READY TO PROCESS displayed in the STATUS column.
This report is now ready to run. Click the blue play button in the RUN column to start the inference.
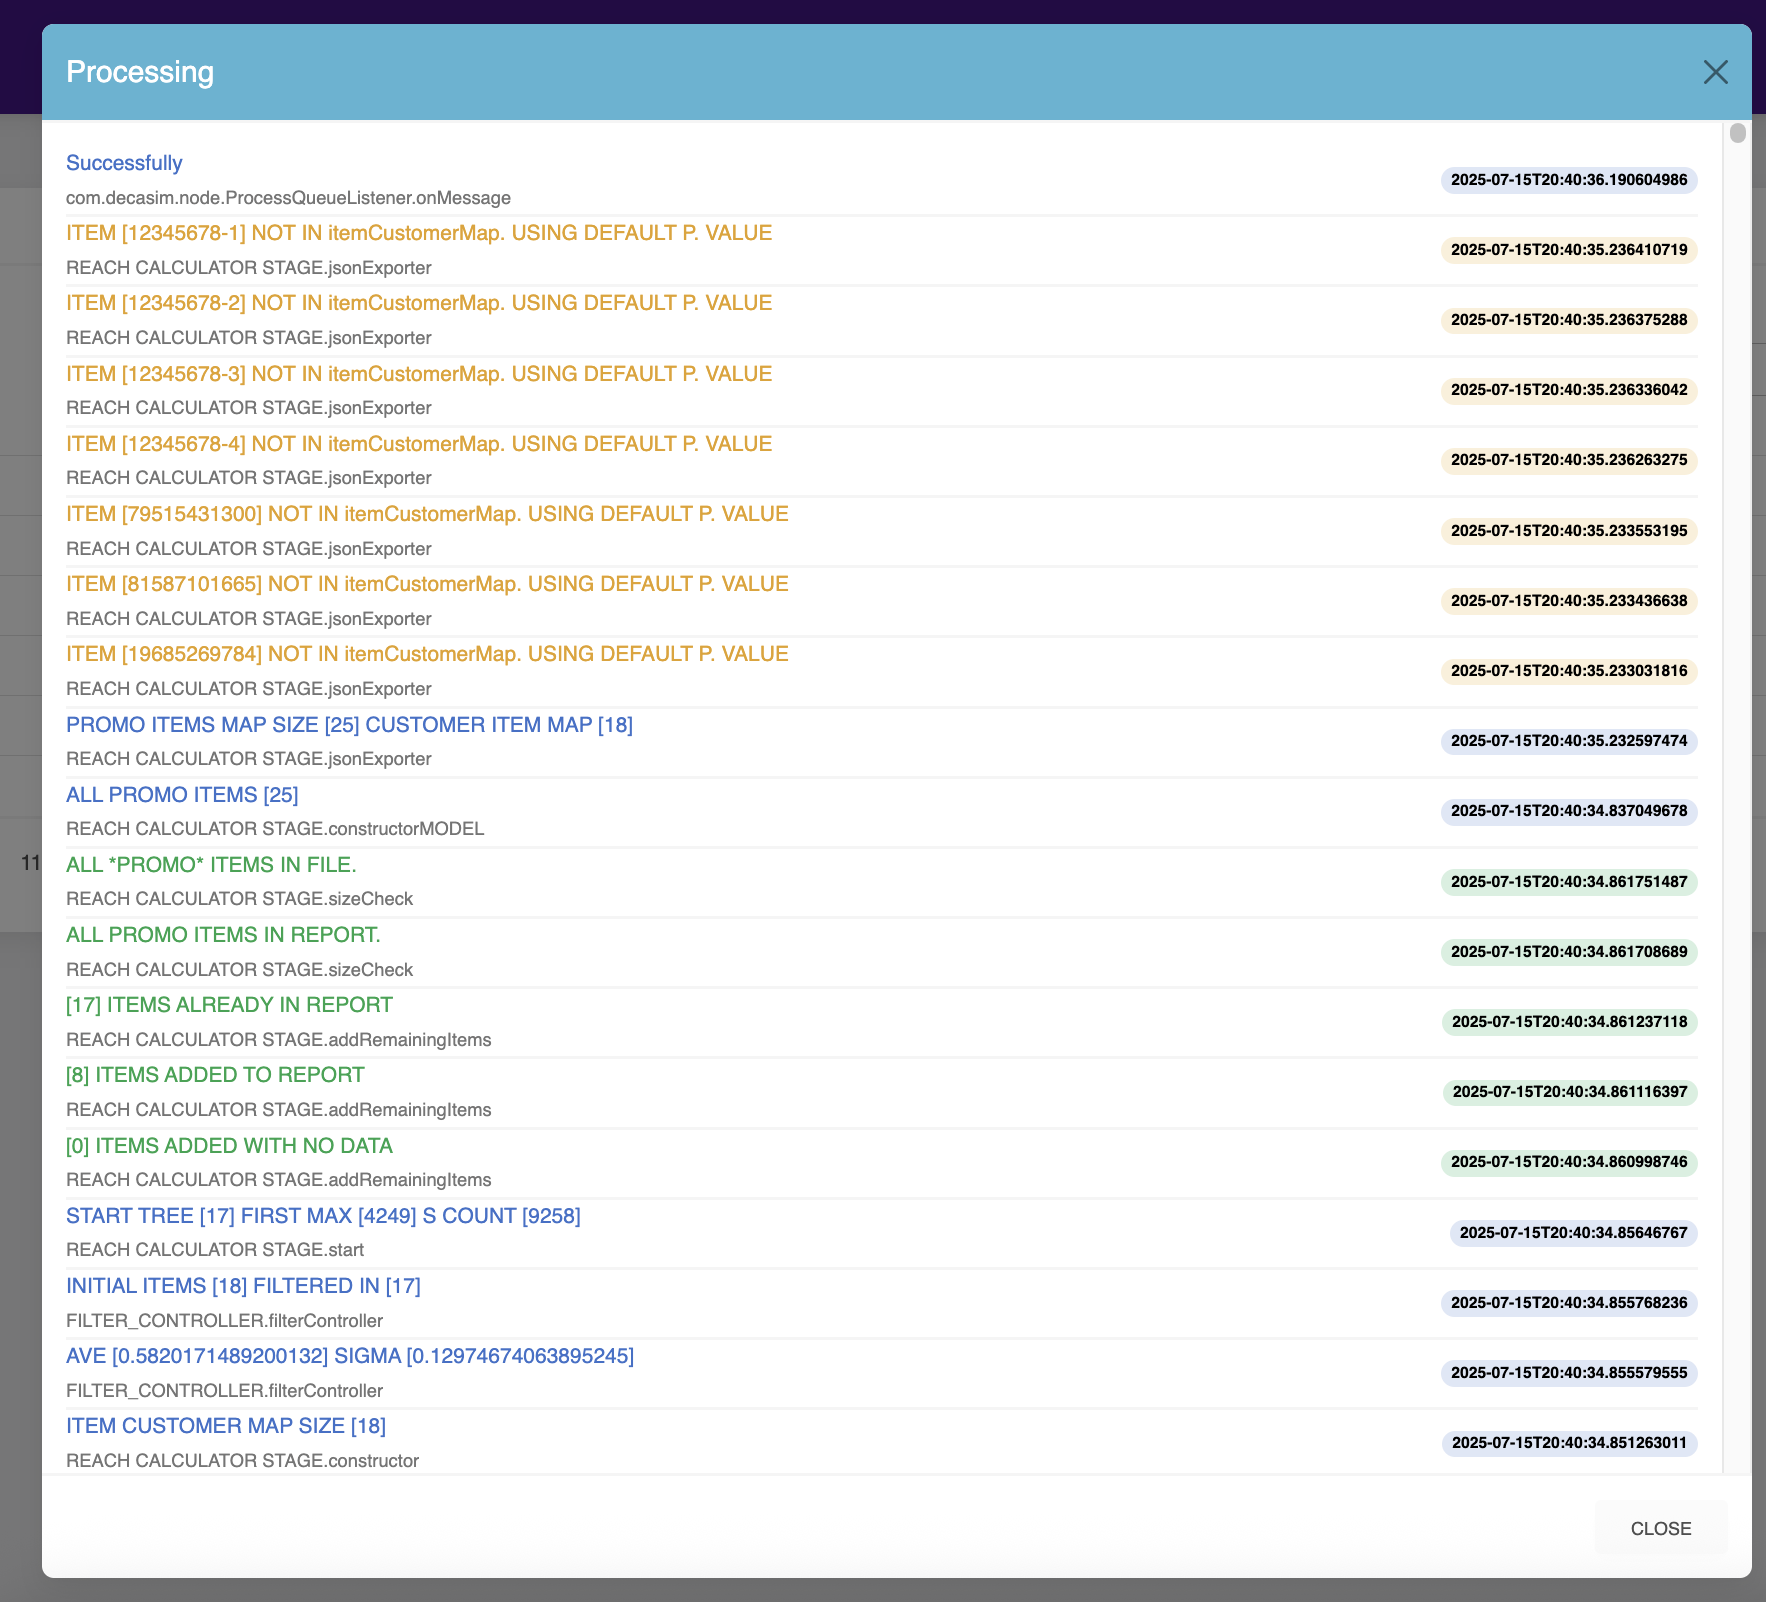
While the AI inference is run to generate the report - the play button turns into a blue eye icon. Clicking on this will display the logs as the AI inference is running.
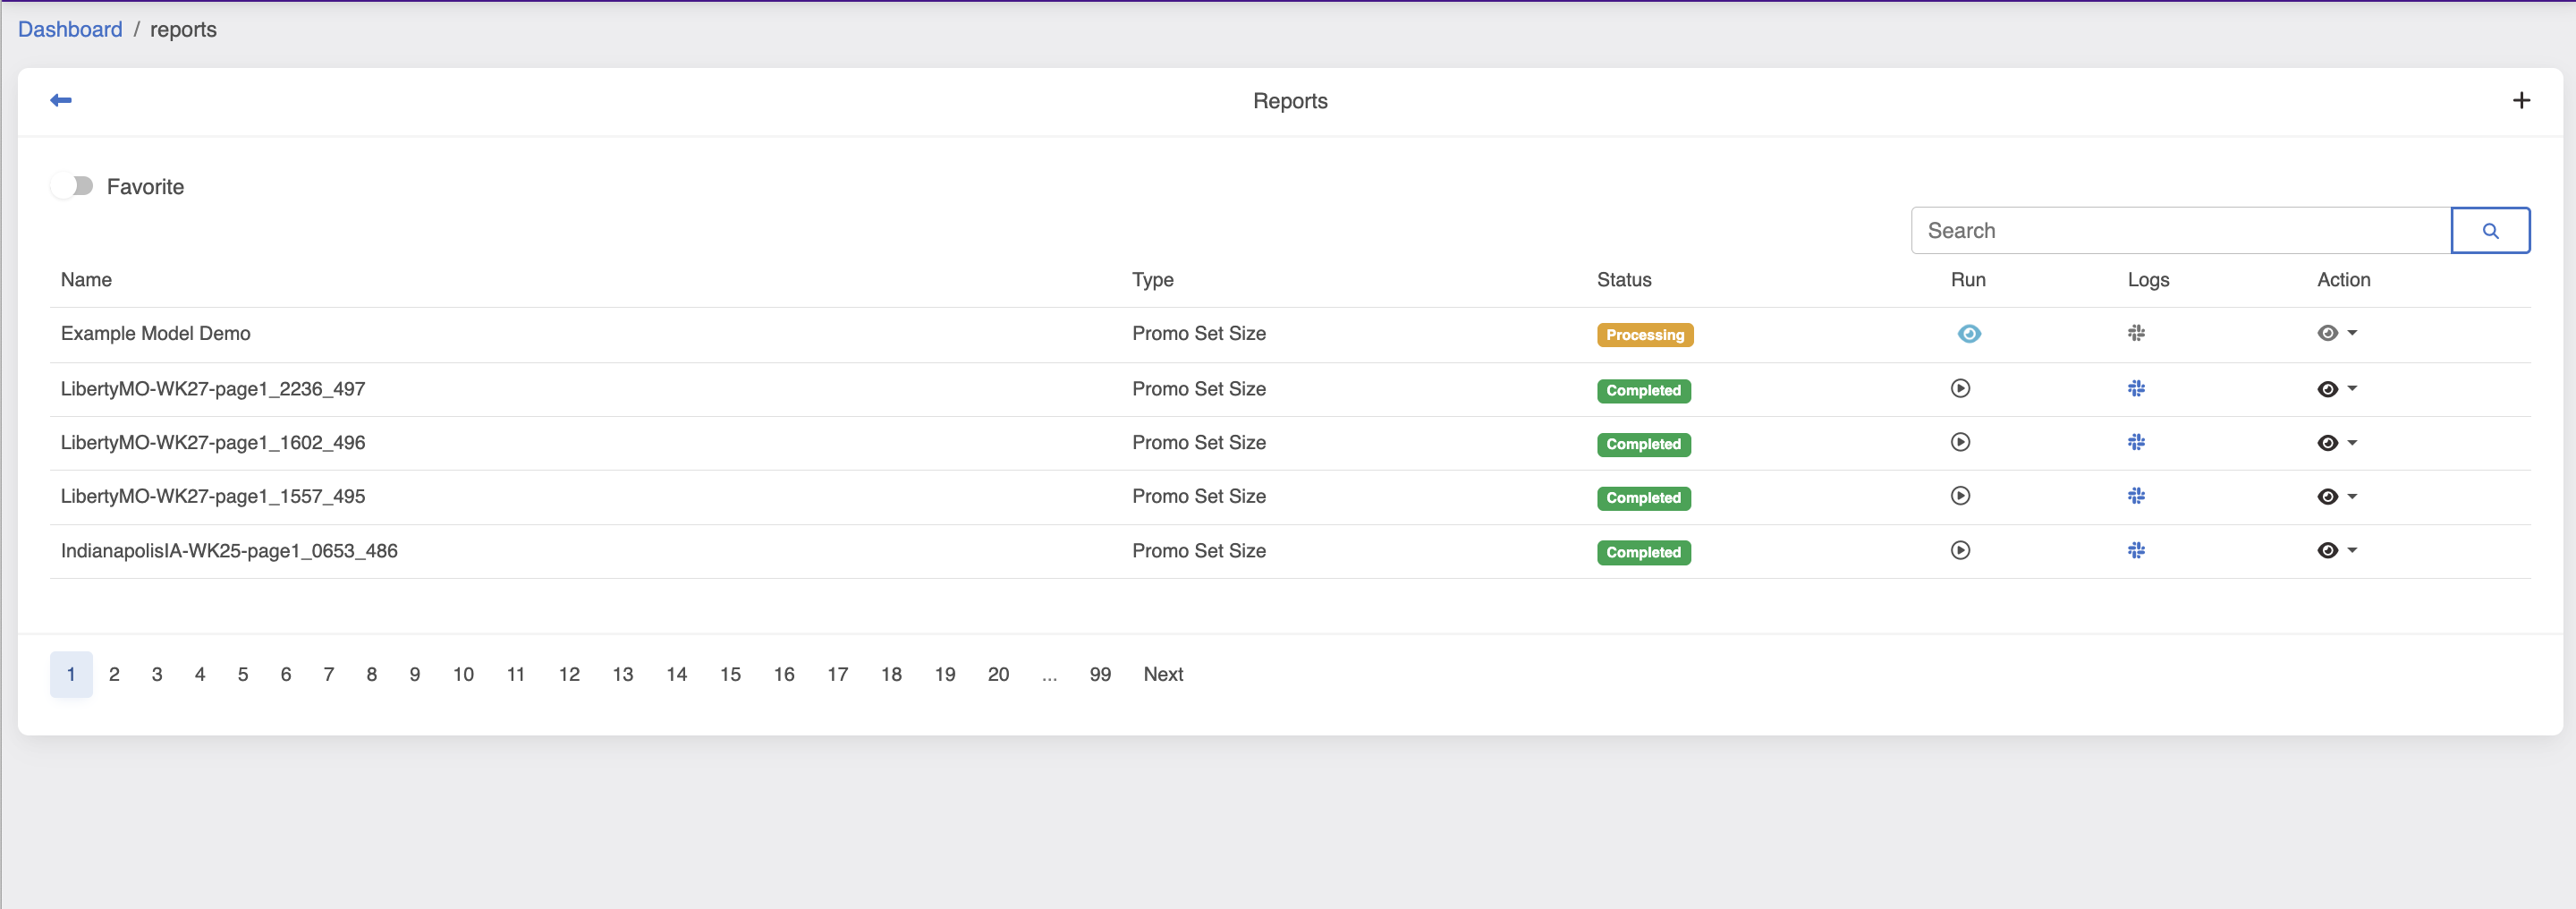
The inference engine takes takes ~45 seconds to run, to pass the time and monitor progress you can view the logs that stream from bottom-to-top showing different steps.
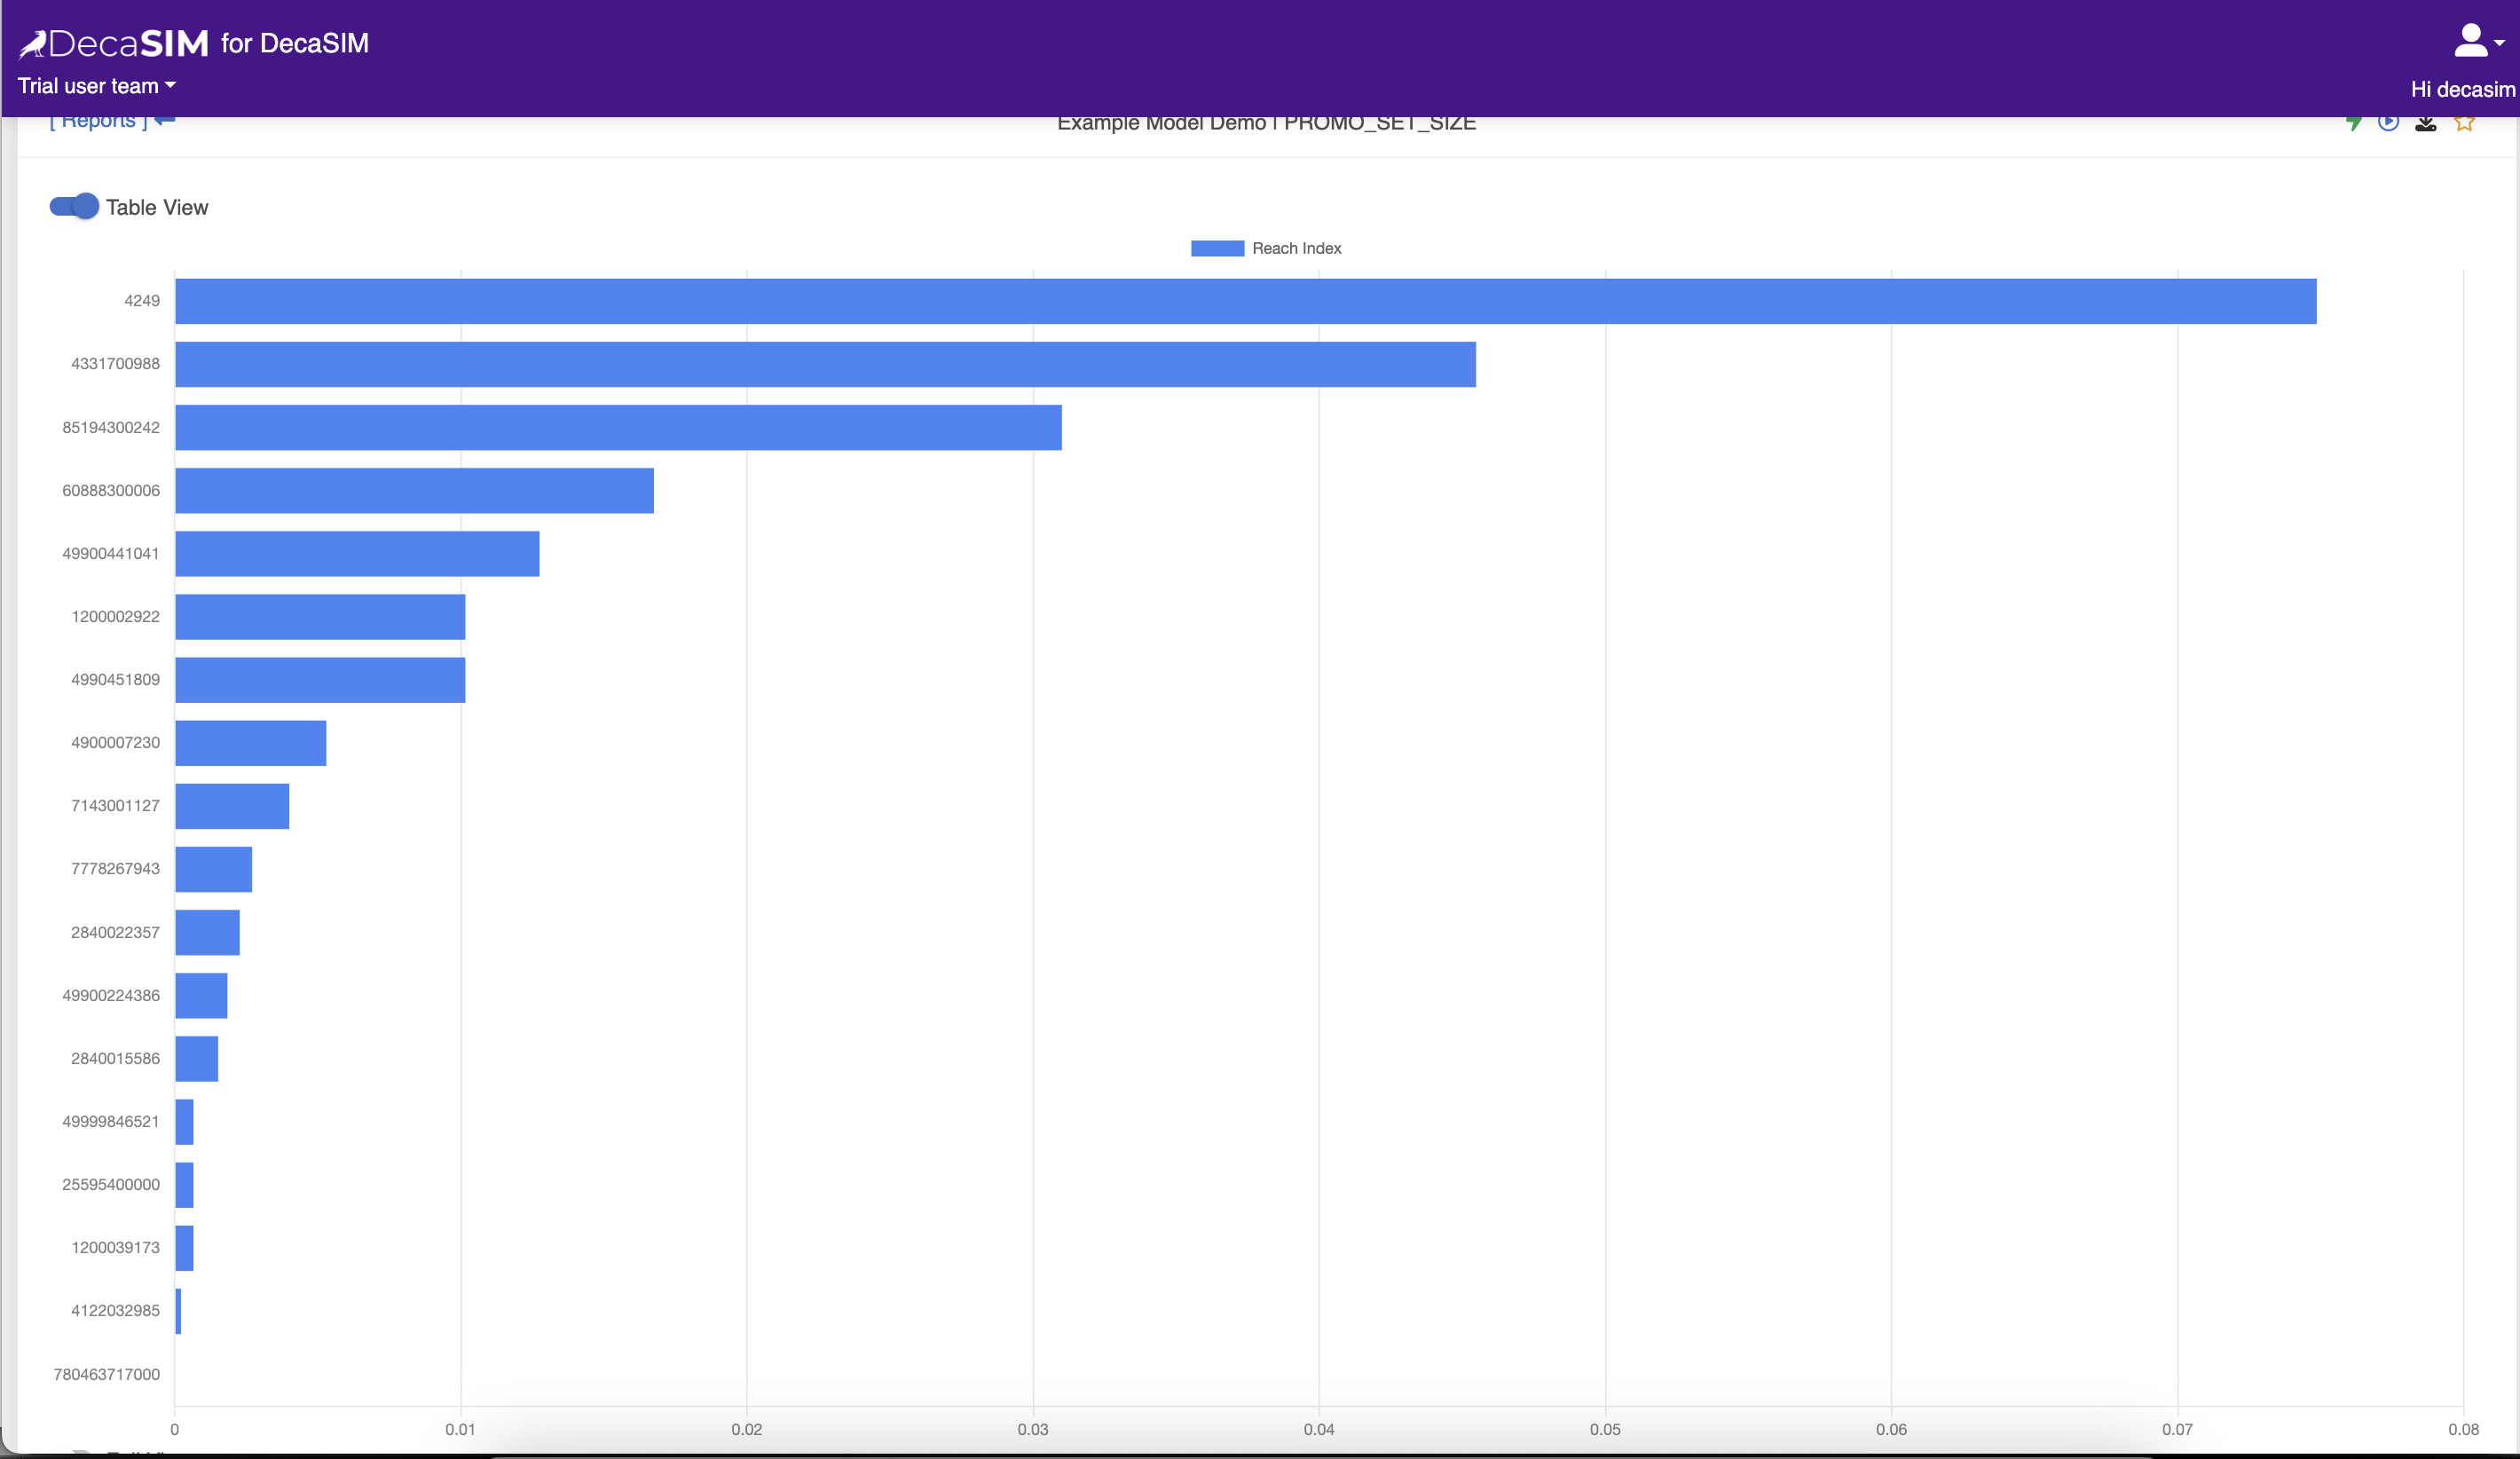
Once the report has run its status will be set to COMPLETED or ERROR. To view the results of a COMPLETED report click the eye icon in the ACTION column.
The default view is to display a graph of the reach score (a proxy for how many customers each promo uniquely appeals to) and a table of the results.
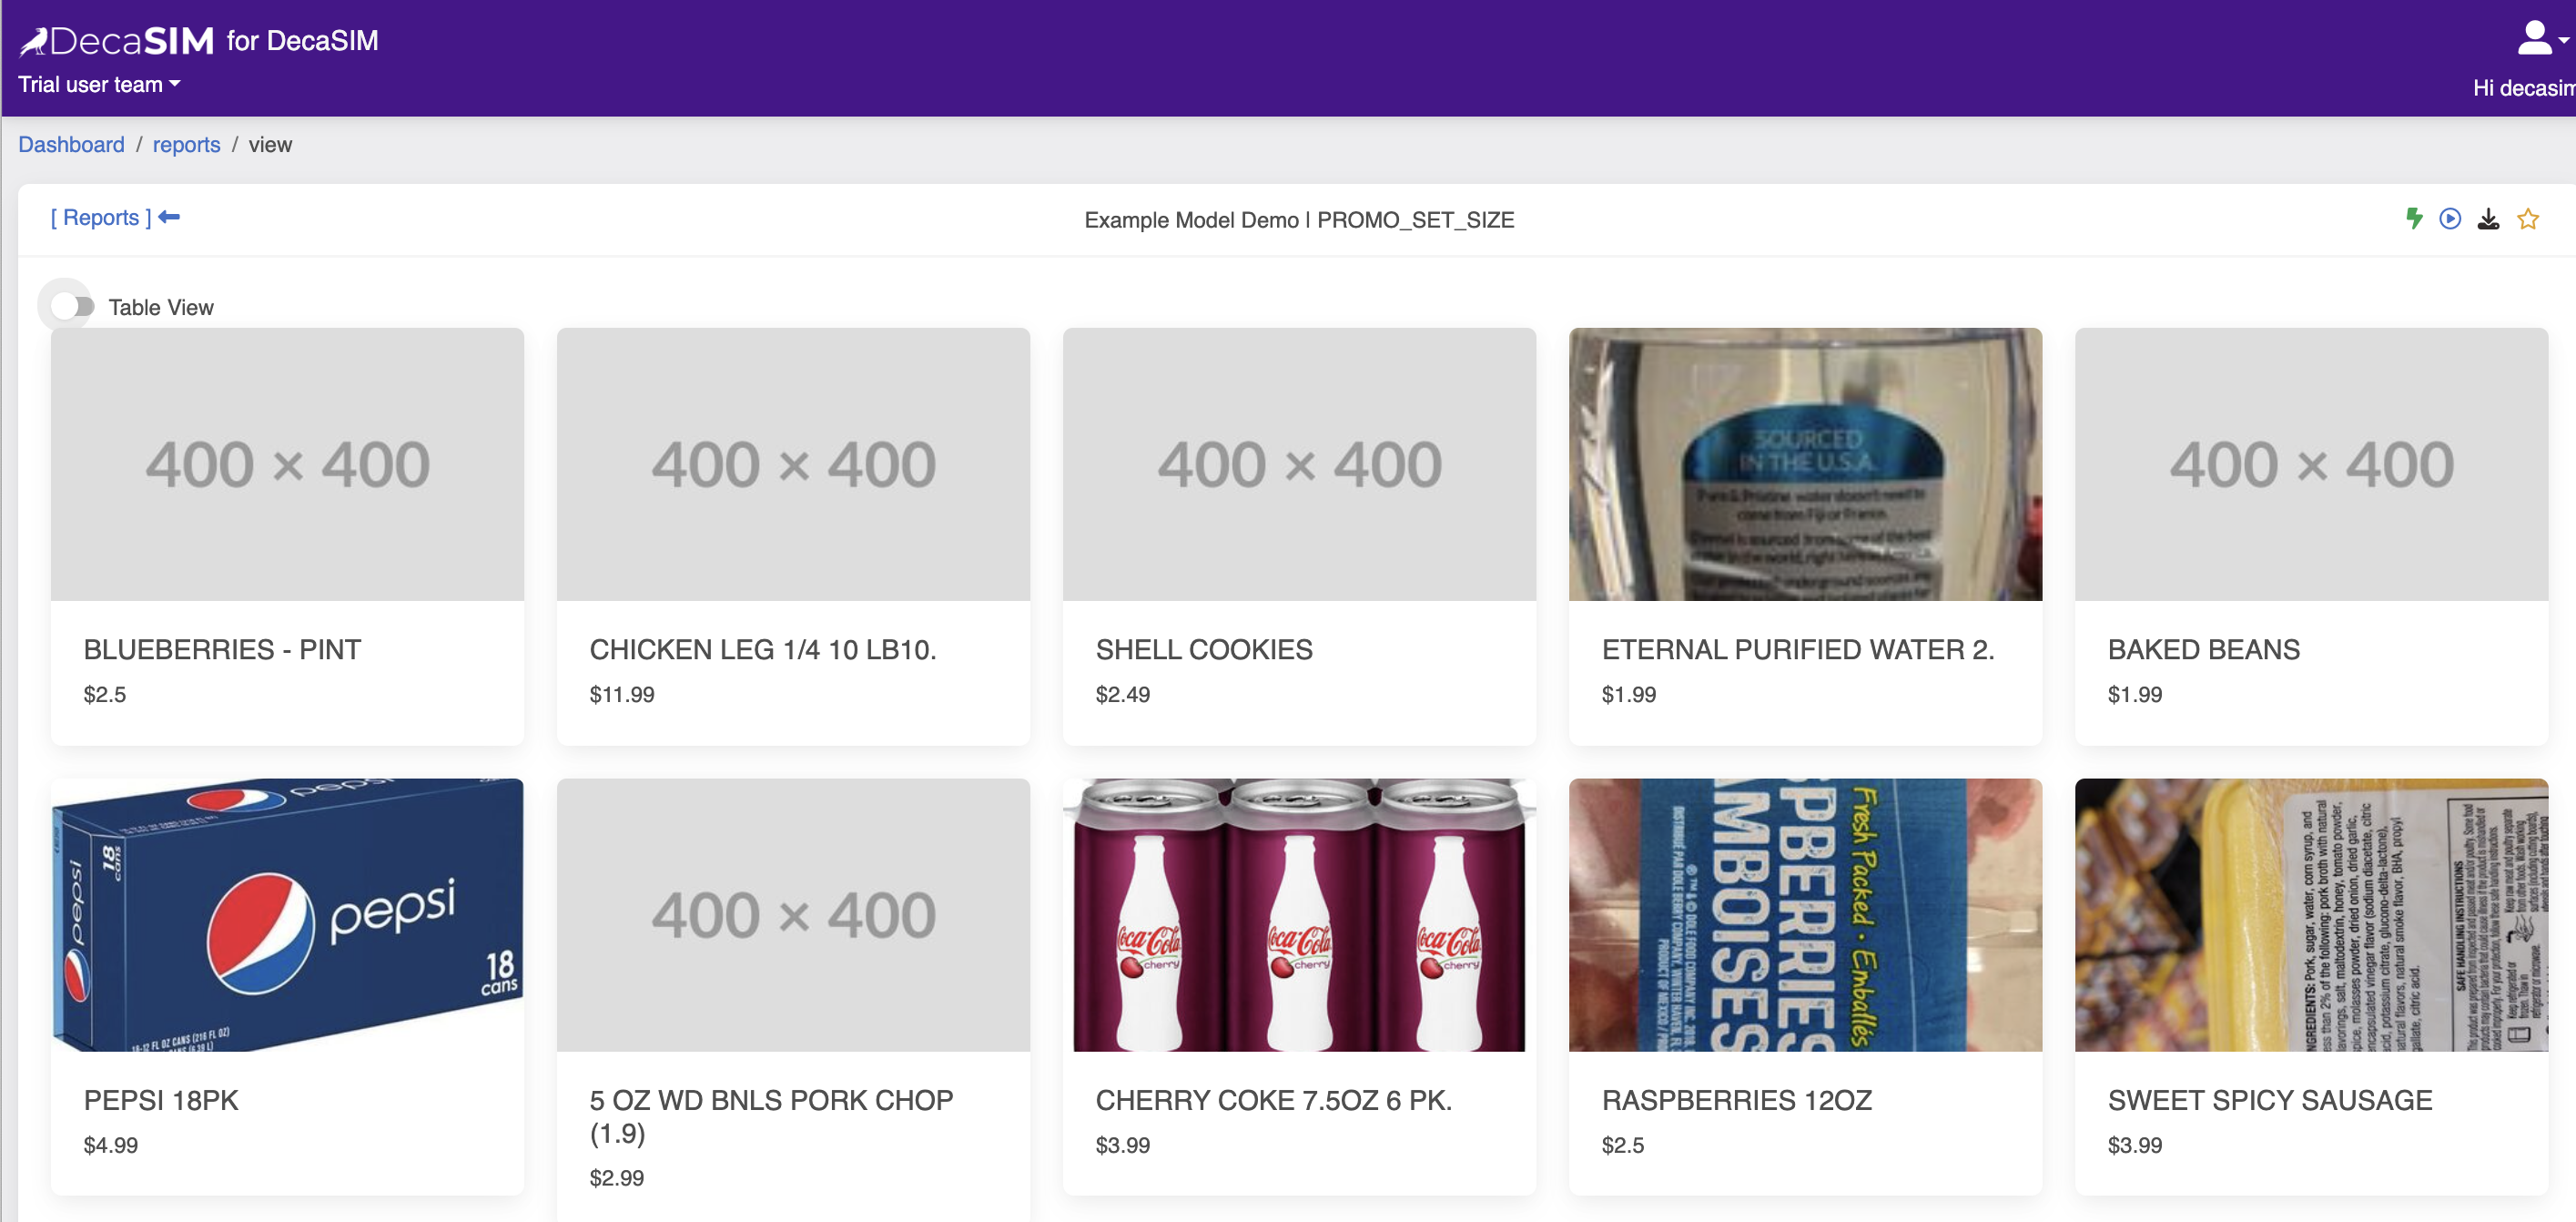
Toggling the Table View to off will change the display to show the ranked promos alongside product pack shots.
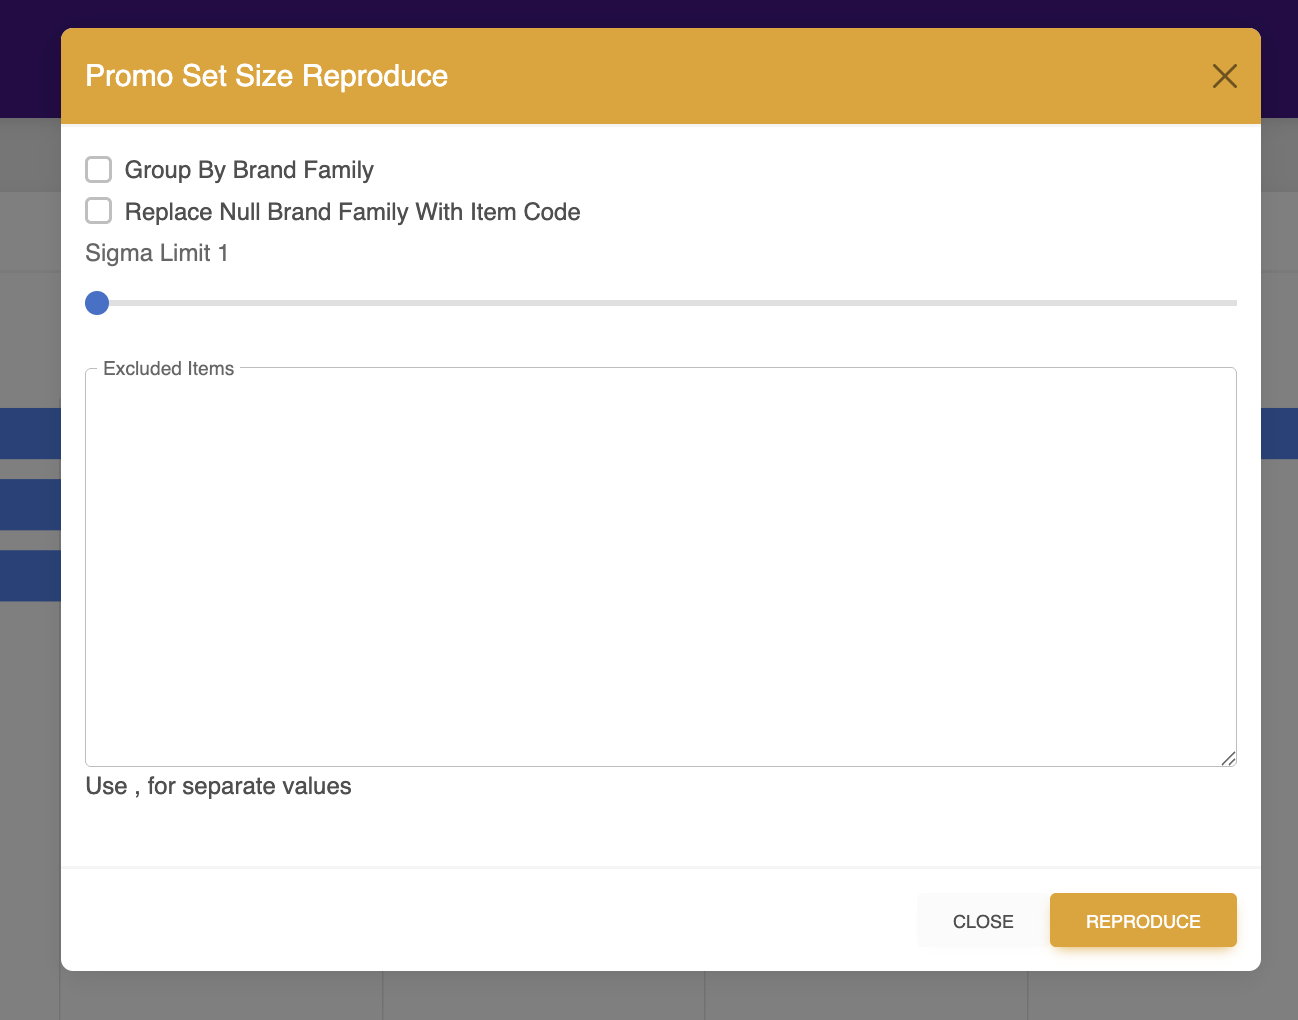
To rerun the report, click the play button in the top right of the report view. This will display a form that allows you to rerun the report and adjust some report parameters:
Group By Brand Familythis combines items that are from the same brand family when reporting resultsReplace Null Brand Family With Item Codeshould be checked.Sigma Limitremove items with a score greater or less than the average penetration (reach score) +/- this number of standard deviations.Exclude Itemstype or paste in a comma separated list of UPCs to exclude from the calculation.Reproduceclick this button to rerun the report.